Spring Boot 監控實戰:Prometheus+Grafana 完整搭建指南
生產環境瞬息萬變,主流的架構都是通過Prometheus進行數據采集指標并通過grafana進行增強式渲染,這種操作也就是我們常說的監控埋點。而本文將針對這套主流方案進行簡單的介紹,并給出一個針對spring boot應用程序的監控埋點,希望對你有幫助。

一、詳解spring boot應用埋點實踐
1. 基本架構說明
按照主流的java開發技術棧,主流監控埋點方案為:
- spring actuator暴露監控指標
- prometheus定時輪詢采集指標
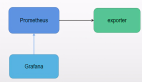
- grafana定時查詢prometheus指標完成圖表渲染
對應監控埋點通信架構如下圖所示:

2. spring boot應用集成prometheus
有了上述的基本概念,我們就可以嘗試落地這套方案了,首先自然是在應用中集成必要的依賴:
- spring-boot-starter-actuator:暴露spring內置的各項監控指標,因為該依賴默認已經完成了對Prometheus的支持,所以引入該依賴后救護內置許多Prometheus風格的端點數據。
- micrometer-registry-prometheus:用于將用戶自定義監控嗎指標以prometheus風格輸出
<!--暴露spring監控指標-->
        <dependency>
            <groupId>org.springframework.boot</groupId>
            <artifactId>spring-boot-starter-actuator</artifactId>
            <version>2.4.1</version>
        </dependency>

        <!--用于導出prometheus系統類型的指標數據-->
        <dependency>
            <groupId>io.micrometer</groupId>
            <artifactId>micrometer-registry-prometheus</artifactId>
            <version>1.1.4</version>
        </dependency>
application.properties或application.yml文件添加如下幾項配置,對應含義筆者都已詳細注釋,這里筆者需要補充說明的是base-path這個配置,默認情況下,我們暴露出去的端點映射為/actuator,如果考慮到安全抑或是其他方面的顧慮,讀者可以修改映射地址:
# 暴露并開啟所有的端點
management.endpoints.web.exposure.include=*
# 展示所有的健康信息
management.endpoint.health.show-details=always
# 默認/actuator/Prometheus,添加這個tag方便區分不同的工程
management.metrics.tags.applicatinotallow=${spring.application.name}
# Actuator 監控端點獨立端口設置為 18080(與主應用端口分離)
management.server.port=18080
# Actuator 端點的根路徑改為 /management(默認是 /actuator)
#management.endpoints.web.base-path=/management
聲明一個配置類,聲明一個MeterRegistryCustomizer表達式附加通用標記列表以應用于報告給監視系統的所有指標,必須是偶數個參數,表示標記的鍵值對,以筆者為例這里針對所有指標打上application方便后續prometheus可以通過工程名區分監控指標:
@Configuration
public class MeterRegistryConfig {

    @Bean
    MeterRegistryCustomizer<MeterRegistry> configurer(@Value("${spring.application.name}") String applicationName) {
        //將應用指標用打上application標簽,值為應用名,方便后續prometheus根據應用名做區分
        return registry -> registry.config().commonTags("application", applicationName);
    }

}
完成上述配置后,我們可以將應用啟動,并訪問http://127.0.0.1:18080/actuator/prometheus,即可看到應用的各種actuator指標:

3. prometheus安裝
鍵入wget指令完成prometheus壓縮包下載,這里筆者下載的是2.11.1版本:
sudo wget https://github.com/prometheus/prometheus/releases/download/v2.11.1/prometheus-2.11.1.linux-amd64.tar.gz完成下載后,將其解壓縮并重命名方便后續定位和使用:
tar -xvf prometheus-2.11.1.linux-amd64.tar.gz
 mv prometheus-2.11.1.linux-amd64 prometheus
執行vim prometheus.yml 追加如下配置:
- job_name:配置當前監控指標數據源的標簽
- metrics_path:指明查詢端點路徑
- static_configs:通過targets指明配置數據的拉取路徑的目標端點的ip和端口號
# A scrape configuration containing exactly one endpoint to scrape:
# Here it's Prometheus itself.
scrape_configs:
  # The job name is added as a label `job=<job_name>` to any timeseries scraped from this config.
  - job_name: 'prometheus'
    # metrics_path defaults to '/metrics'
    # scheme defaults to 'http'.
    # 這里配置需要拉取度量信息的URL路徑,這里選擇應用程序的prometheus端點
    metrics_path: '/actuator/prometheus'
    static_configs:
      # 這里配置host和port
      - targets: ['127.0.0.1:18080']
進入目錄并將prometheus啟動:
cd prometheus/
sudo ./prometheus
prometheus默認情況下開放的端口為9090,所以完成上述部署工作后我們可以通過ip:9090/targets訪問引入的targets,以筆者為例,可以看到我們的應用暴露的端點顯示在了prometheus的target映射下:

點擊該鏈接地址后,可以看到應用上各個監控指標,同時標簽的花括號內部也可以看到筆者全局打上的application標簽:

4. grafana安裝與配置
打通了prometheus數據采集之后,我們就可以通過grafana進行數據增強渲染了,首先自然是完成grafana的下載,考慮到版本兼容性筆者下載的是8.4.1版本,同時考慮到下載速度,筆者這里選用的是阿里云的鏡像源:
wget https://mirrors.aliyun.com/grafana/apt/pool/main/g/grafana/grafana_8.4.1_amd64.deb執行dpkg -i完成grafana安裝:
sudo dpkg -i grafana_8.4.1_amd64.deb將grafana啟動并設置開機自啟:
sudo systemctl start grafana-server
sudo systemctl enable grafana-server
默認情況下grafana開放的端口號是3000,通過ip:3000訪問地址并輸入默認賬號密碼admin/admin即可訪問該面板:

首先我們需要將prometheus的數據源引入,點擊configure選擇datasource:

可以看到默認情況下,grafana已經給出了prometheus的配置項,所以我們直接點擊這個數據源修改編輯即可:

以筆者為例,所有配置項都選擇默認,將url指向prometheus的訪問地址即可:

修改URL地址之后,點擊save and test,如果界面顯示data source is working則說明本次數據源配置成功:

因為grafana社區比較活躍,所以針對各種應用埋點也都內置了強大的模板,所以針對我們的監控數據源也打算采用一些主流的模板來增強監控指標的渲染。
首先我們點擊import選擇進行模板導入:

通用面板我們可以訪問https://grafana.com/grafana/dashboards/ ,并搜索spring boot查看一些通用模板:

這里逼著選擇了JVM (Micrometer)點擊download JSON復制模板下載模板文件:

將下載好的JSON文件打開并將內容粘貼到導入面板下并點擊load:

按照提示選擇我們配置的Prometheus數據源并點擊import

自此,整套監控體系搭建完成:

二、小結
本文通過一張架構圖梳理spring boot應用監控埋點的工作原理以及部署方式,然后配置了一個簡單的spring boot應用并將其與Prometheus串聯,再通過grafana完成監控數據增強渲染便于開發人員快速定位并修復。需要補充的是,本文著重于介紹監控埋點方案的介紹,關于監控指標的原理和應用,逼著會在后續的文章中展開說明。